Including Data
Data Tables
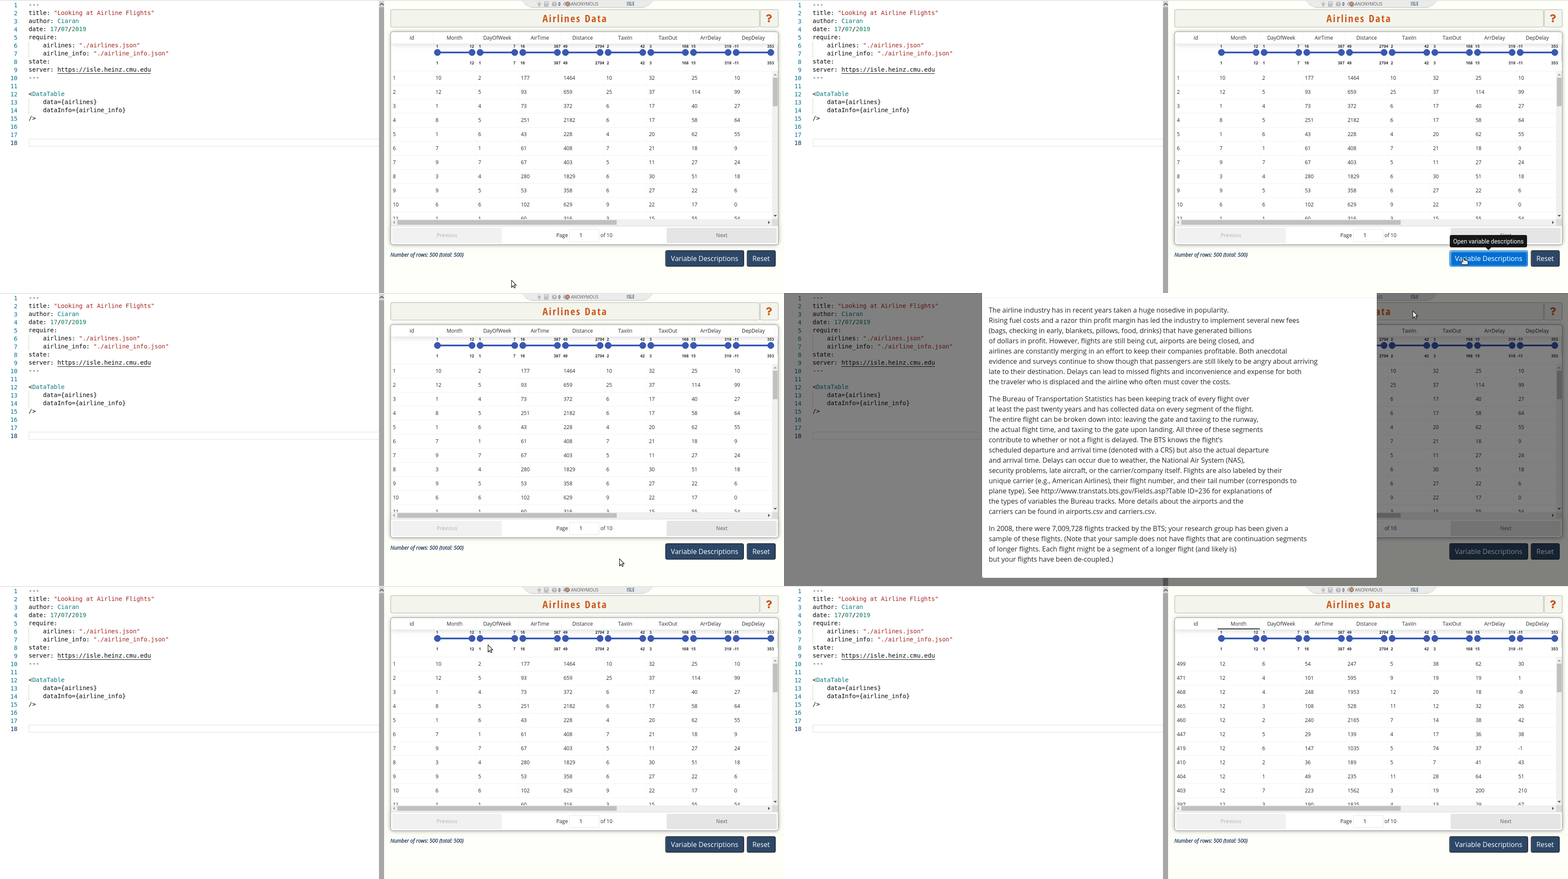
The <DataTable/> tag in ISLE allows you to include a Data Table, which users can then explore. For example, here is a gif of an ISLE file that includes data on airline flights, and the resulting table as displayed to users:

The code shown here is
---
title: "Looking at Airline Flights"
author: Ciaran
date: 17/07/2019
require:
    airlines: "./airlines.json"
    airline_info: "./airline_info.json"
state:
---

<DataTable
    data={airlines}
    dataInfo={airline_info}
/>
Note that this piece of example code includes the preamble to the document, whereas in previous tutorials we've omitted the preamble. The preamble is included here because in this case the <DataTable/> tag interacts with the preamble, whereas in the earlier examples no changes to the preamble needed to be made for the code to work.
There are a few important components to this code:
require: therequirestatement in the preamble is used to import files. Here we have imported two files,airlines.jsonandairline_info.json, by providing the local path to these files (in this case, the two files are in the same directory as the ISLE file). To reference the content of these files, we have assigned names (respectivelyairlinesandairline_info) to the imported content. In this case, the names we chose match the base name of the files, but this is not necessary. We then use this content in the<DataTable/>tag through the names we chose in therequirestatement.the data file: this file contains the data we want to display in the Data Table, using the
datafield of the<DataTable>tag. Here, the data file isairlines.json. The file can be provided in CSV or JSON format, more details will be provided below. You can download a zipped folder containing the two files used in this example here.the data info file: this (optional) file contains information about the data, such as the name of the data set, a short description of the data and its source, and variable descriptions for each of the columns. The data info is displayed by using the
dataInfofield of the<DataTable/>tag. The data info needs to be in JSON format (see below).
JSON Format
JSON is a nice way of storing data. Here is what a very small JSON data file might look like:
{
    "Age": [3, 4, 3, 6],
    "FavColor": ["red", "blue", "purple", "green"],
    "HairColor": ["black", "brown", "brown", "blonde"]
}
Each variable name is provided in quotes (" "), followed by a colon (:). After the colon, we list all of the observed values for that variable, in the order they will appear in the data table. The observed values are separated by commas, and the variables are also separated by commas. Finally, the variables are all wrapped in { }.
Here is what the corresponding data info file might look like:
{
    "name": "Colors",
    "info": [
        "This is a toy dataset on four young children.",
        "We record age, favorite color, and hair color."
    ],
    "variables": {
        "Age": "The child's age in years.",
        "FavColor": "The child's favorite color.",
        "HairColor": "The child's hair color."
    }
}
Rather than representing different variables, each element of the data info file provides a different piece of information about the dataset: the name of the dataset (name), a description of the data (info), and descriptions of each variable in the data (variables). For the info field, each line of text is entered separately and separated by commas - the two strings shown in the example here will appear on different lines. Note that the info field uses square brackets ([ ]) whereas the variables field uses curly brackets ({ }).
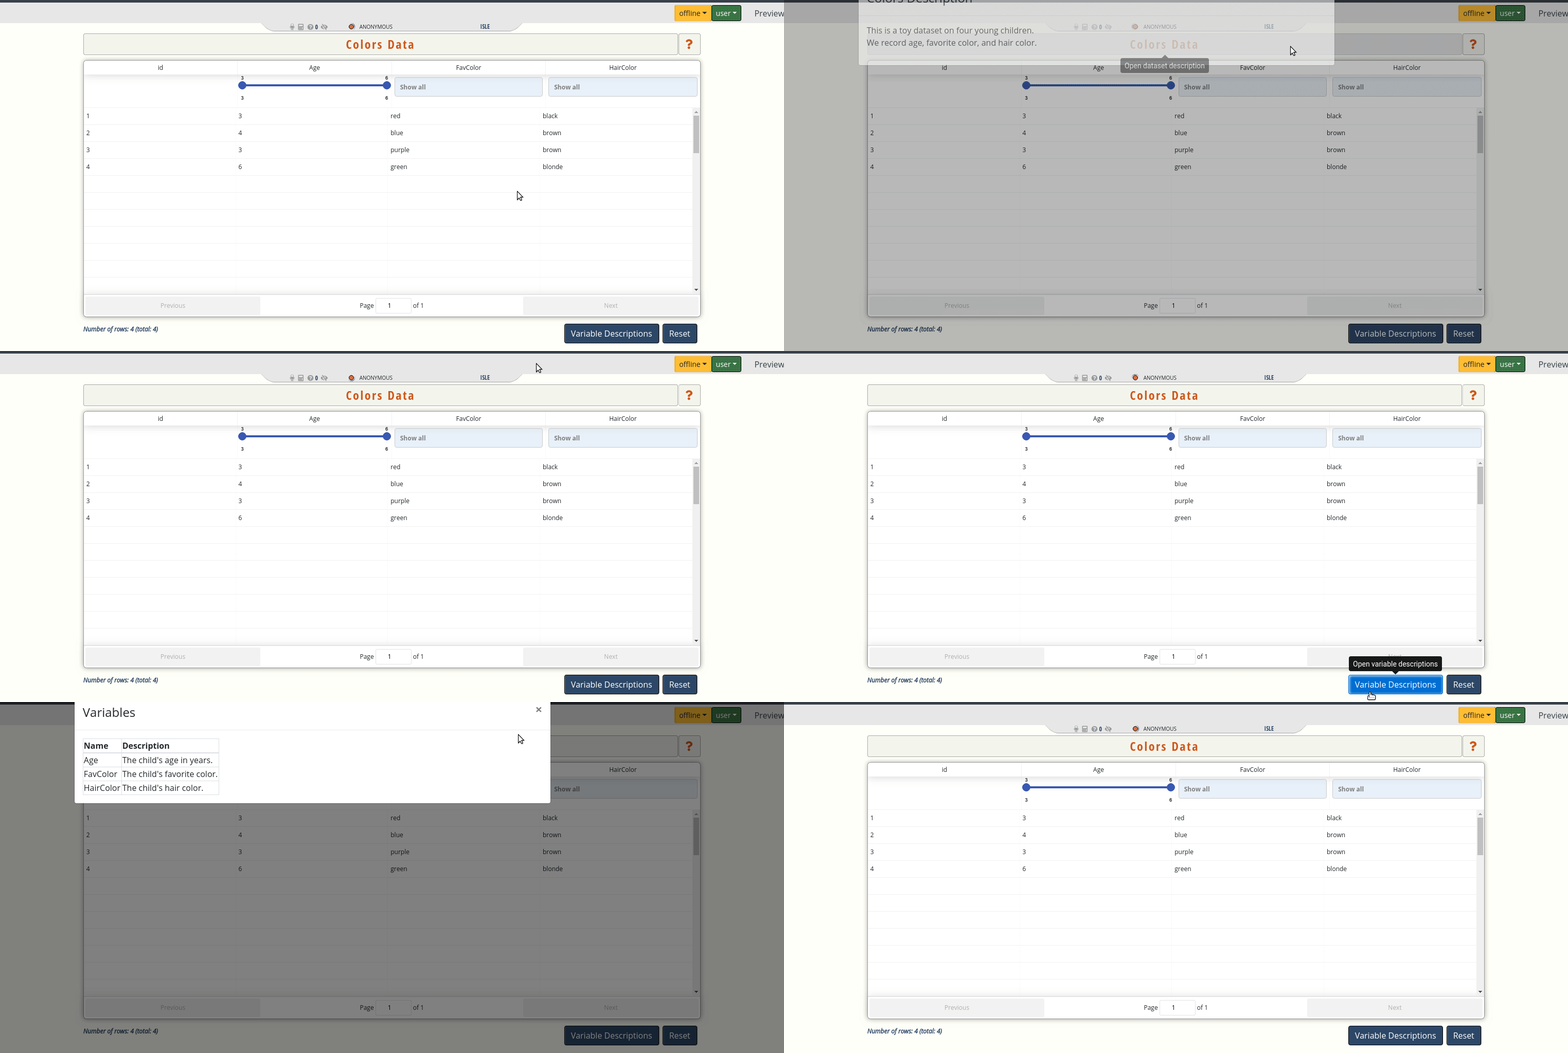
If we save these as JSON files and import them into the editor in the same way we did the airlines data, the resulting data table looks like this:

Alternatively, because the data and data info are so small in this example, we could directly enter them into the <DataTable/> tag without saving them as JSON files. Here is what the ISLE file looks like to produce the Colors data table shown in the gif:
---
title: "A Toy Data Table"
author: Ciaran
date: 17/07/2019
state:
---

<DataTable
    data={{
        "Age": [3, 4, 3, 6],
        "FavColor": ["red", "blue", "purple", "green"],
        "HairColor": ["black", "brown", "brown", "blonde"]
    }}
    dataInfo={{
        "name": "Colors",
        "info": [
            "This is a toy dataset on four young children.",
            "We record age, favorite color, and hair color."
        ],
        "variables": {
            "Age": "The child's age in years.",
            "FavColor": "The child's favorite color.",
            "HairColor": "The child's hair color."
        }
    }}
/>
Note that for this example, the preamble does not interact with the <DataTable/> code because we are not importing the data that we display.
Converting Data to JSON
If you are an R user, it is pretty straightforward to convert data to JSON using the toJSON function in the jsonlite package. Here is the R code we used to make the airlines.json file used in this tutorial:
library(jsonlite)

airlines = read.table( file = './airlinesnew.txt' )
write( toJSON( airlines, dataframe = 'columns' ), 'airlines.json' )
Data Explorer
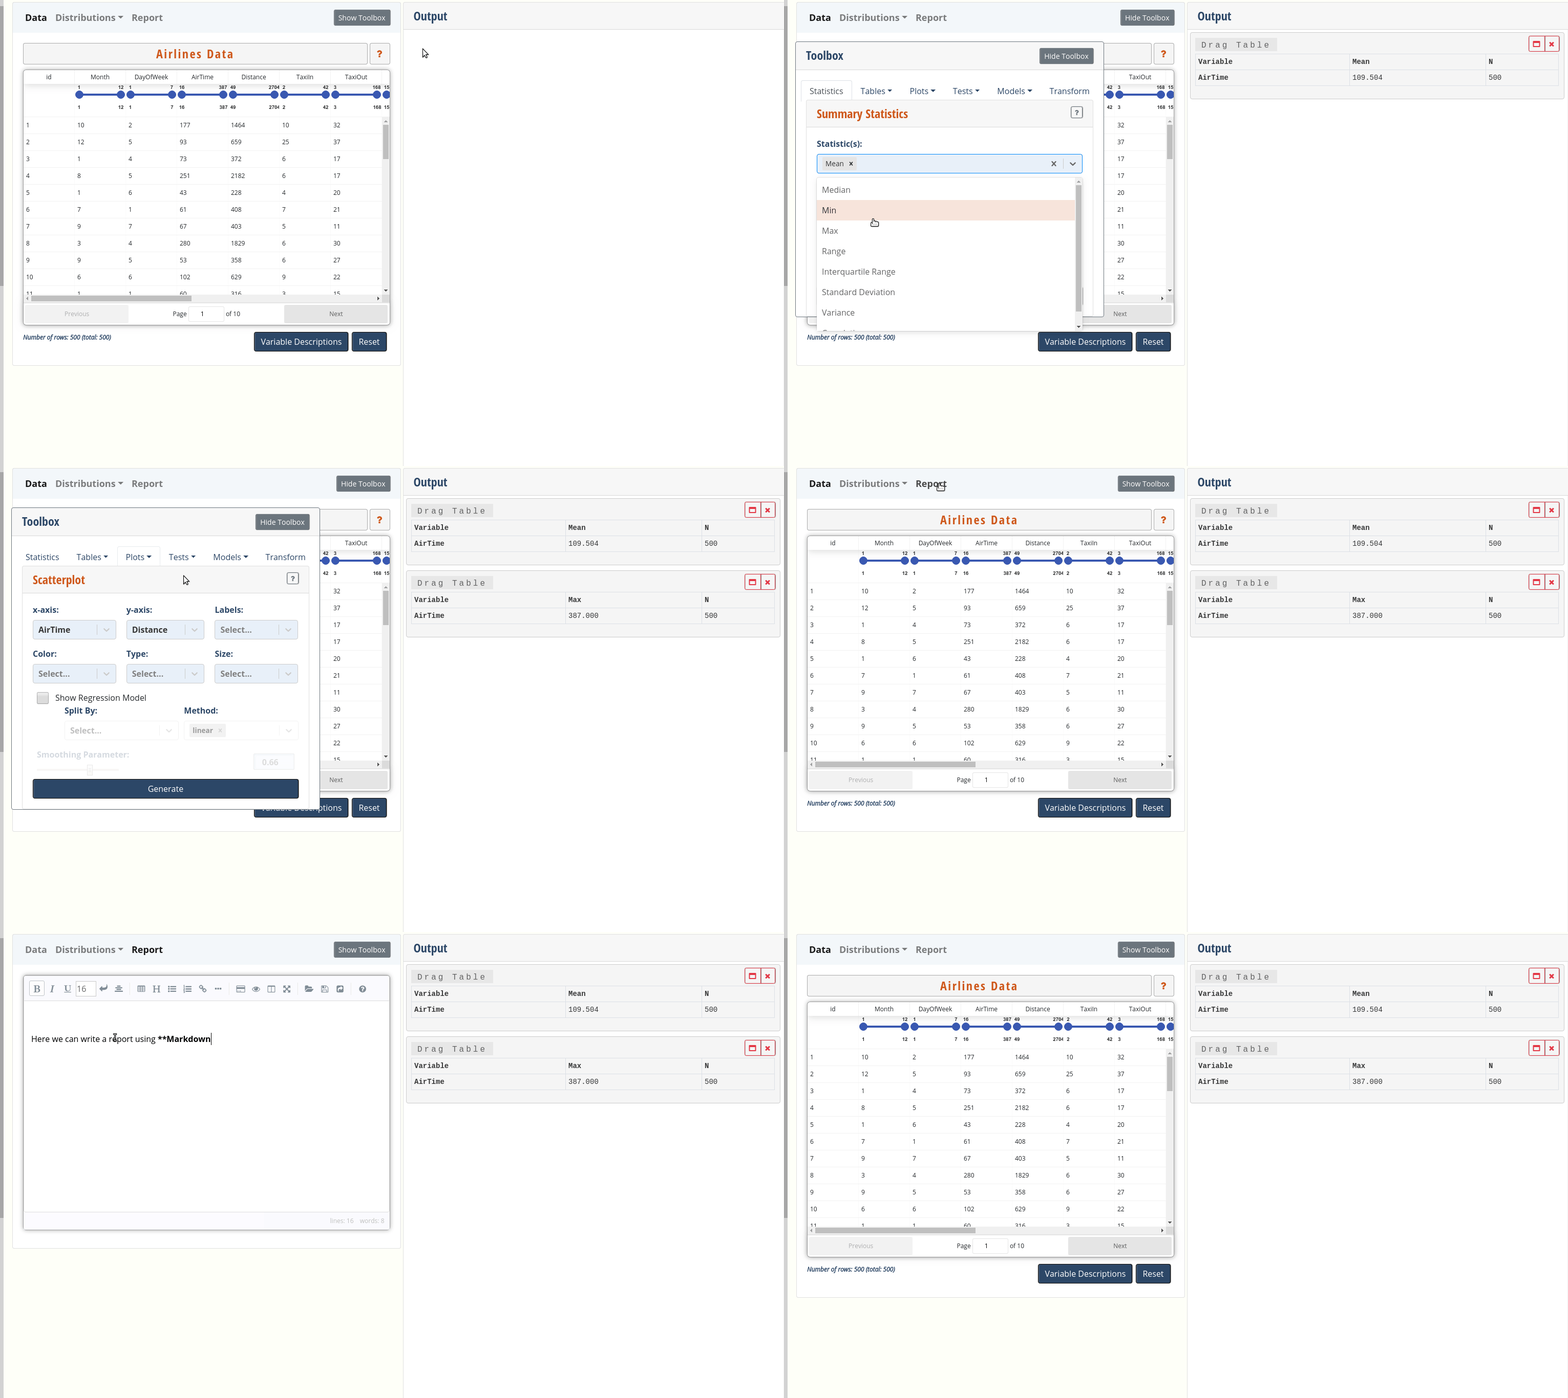
While a Data Table allows you to display data that students can interact with, a Data Explorer enhances a Data Table by providing additional tools to analyze and write about the data. Here is an example of a data explorer created for the airlines data:

This example shows each of the possible data explorer features:
- the data
- a toolbox for calculating statistics, creating tables and plots, carrying out hypothesis tests, and transforming variables
- an output area displaying the toolbox output
- an editor that allows users to write reports and data analyses
- a distributions tab that allows users to explore a few common distributions
The code to generate the data explorer illustrated here is
---
title: "Looking at Airline Flights"
author: Ciaran
date: 17/07/2019
require:
    airlines: "./airlines.json"
    airline_info: "./airline_info.json"
state:
---

<DataExplorer
    data={airlines}
    dataInfo={airline_info}
    categorical={['Month', 'DayOfWeek', 'Diverted', 'Carrier',
    'Weather', 'NAS', 'Security', 'LateAircraft']}
    quantitative={['AirTime', 'Distance', 'TaxiIn', 'TaxiOut', 'ArrDelay',
    'DepDelay']}
/>
Data
Data and data info is included in the explorer in the same way as for the Data Table. As above, we can import CSV or JSON files in the preamble and use the data and dataInfo fields of the <DataExplorer/> tag. The Data tab of the explorer shows the resulting data table. If you do not wish to display the data table in the explorer, you can set the dataTable option to false (see the data explorer docs for more details).
Variable Types
Certain tests, statistics, and plots require specific variable types. For example, it doesn't make sense to make a scatterplot with a categorical variable. Hence, the <DataExplorer/> tag requires that all variables be listed either as categorical (in the categorical option) or quantitative (in the quantitative option).
Toolbox
The explorer's toolbox allows users to perform data analysis. There are several tabs of the toolbox:
Statistics
The Statistics tab allows users to calculate summary statistics on variables. The currently available statistics are Mean, Median, Min, Max, Range, Interquartile Range, Standard Deviation, Variance, and Correlation. By default, all these measures are available in the Statistics tab. To show only a subset, use the statistics option of the <DataExplorer/> tag (see below for an example).
Tables
The Tables tab allows users to make tables from variables. The currently available tables are Frequency Tables and Contingency Tables. By default, these two tables are available in the Tables tab. To show only a subset, use the tables option of the <DataExplorer/> tag (see below for an example).
Plots
The Plots tab allows users to make plots with the data. The currently available plots are Bar Chart, Pie Chart, Histogram, Box Plot, Scatterplot, Heat Map, Mosaic Plot, and Contour Chart. By default, all plots are available in the Plots tab. To show only a subset, use the plots option of the <DataExplorer/> tag (see below for an example).
Tests
The Tests tab allows users to carry out hypothesis tests. The currently available tests are One-Sample Mean Test, One-Sample Proportion Test, Two-Sample Mean Test, Two-Sample Proportion Test, Correlation Test, Chi-squared Independence Test, and One-Way ANOVA. By default, all tests are available in the Tests tab. To show only a subset, use the tests option of the <DataExplorer/> tag (see below for an example). Hypothesis tests in ISLE also show a test decision based on a provided significance threshold and the calculated p-value. To display only the p-value, and not the test decision, set showTestDecisions to false.
Models
The Models tab allows users to fit models to the data. The currently available models are Simple Linear Regression. To show only a subset, use the models option of the <DataExplorer/> tag (see below for an example).
Transform
The Transform tab allows users to create new variables through variable transformations. By default, the Transform tab is visible. To hide the Transform tab, set transformer={false} option in the <DataExplorer/> tab, as seen in the data explorer example above.
Customizing the Toolbox
Suppose we want to customize the toolbox in the following ways:
- For statistics: Mean and Median
- For tables: Contingency Table
- All plots
- For tests: One-Sample Mean Test, Correlation Test, Chi-squared Independence Test. And do not show test decisions
- No models
- Show the variable transformer
Then our <DataExplorer/> tag could look as follows:
<DataExplorer
    data={airlines}
    dataInfo={airline_info}
    categorical={['Month', 'DayOfWeek', 'Diverted', 'Carrier',
    'Weather', 'NAS', 'Security', 'LateAircraft']}
    quantitative={['AirTime', 'Distance', 'TaxiIn', 'TaxiOut', 'ArrDelay',
    'DepDelay']}
    statistics={["Mean","Median"]}
    tables={["Contingency Table"]}
    tests={["One-Sample Mean Test", "Correlation Test", "Chi-squared Independence Test"]}
    showTestDecisions={false}
    models={[]}
/>
Editor
In the editor, students can write up their data analysis, using basic Markdown for text formatting, and dragging and dropping output images and tables directly into the report. By default, the editor is visible; to hide the editor, set editor={false} in the <DataExplorer/> tag (as in the examples above). By default, the name of the editor tab is Report, but you can change this if you wish using the editorTitle option.